Understanding the app behavior from kernel to app code
get started
Why Choose Kindling
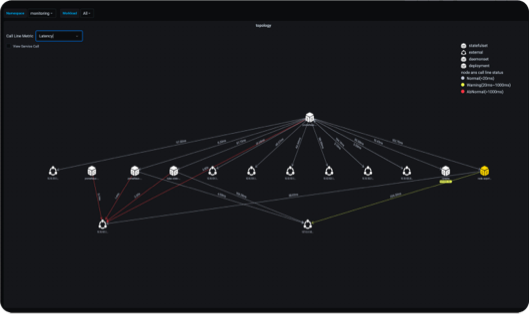
RootCause Tiriage
01
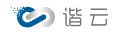
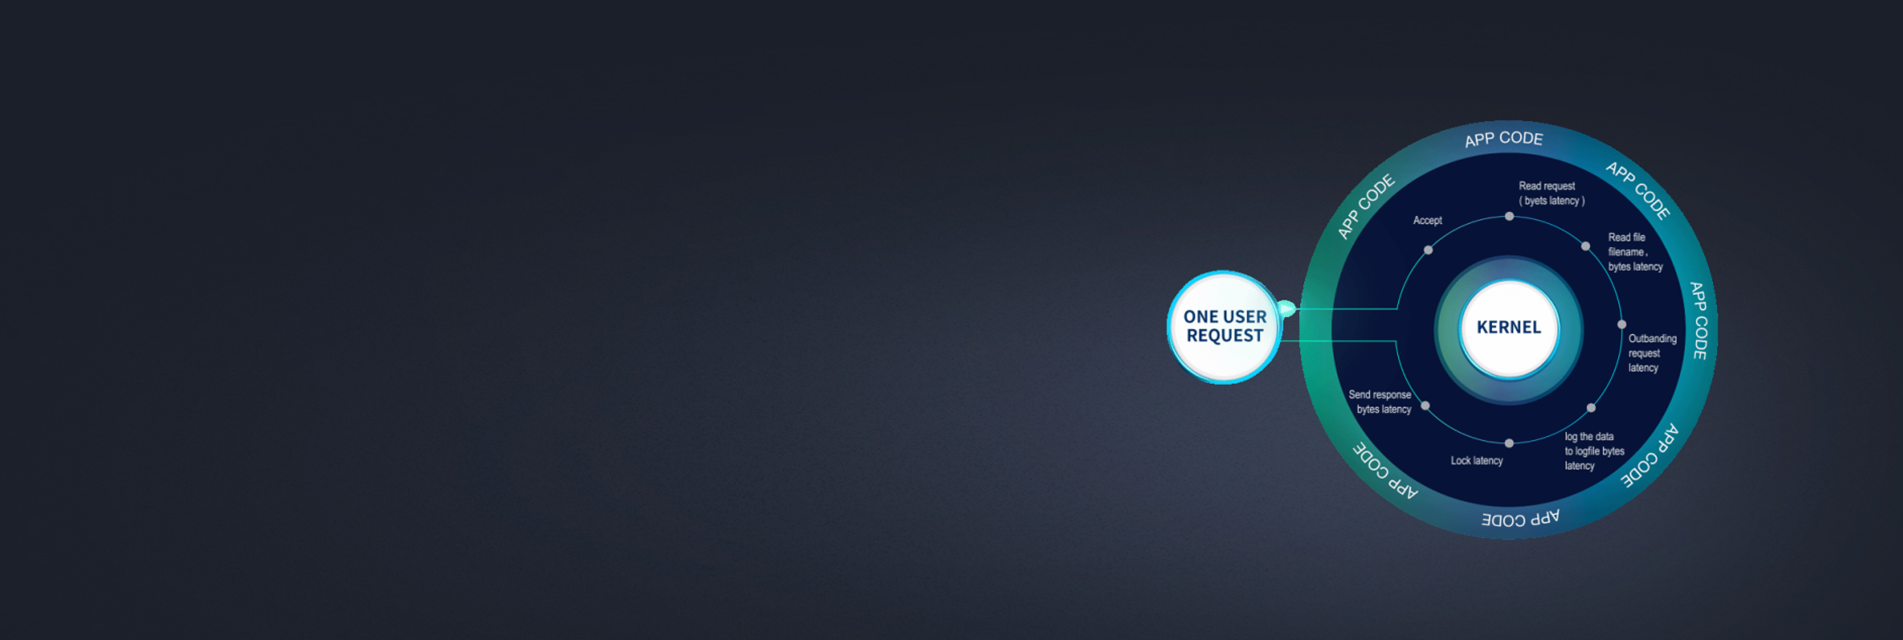
With RPC trace£¨the user can identify the root-cause direction quickly, like if the issue is caused by network issue, code issue, storage issue, mutex Lock issue, the out-banding call issue. The first version can only identify request sending issue, code issue, downloading issue. The other issue identification is under active developing, will coming soon.
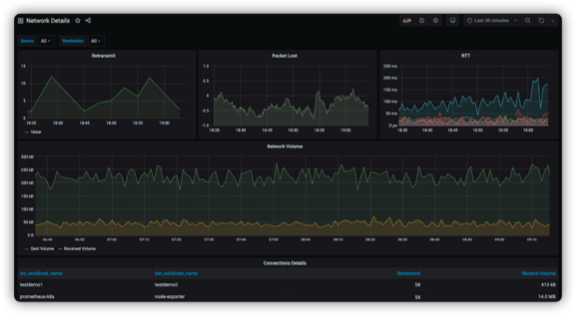
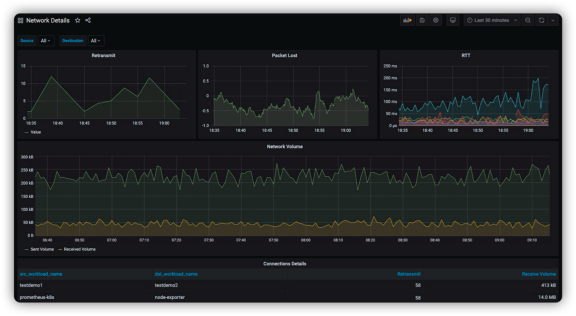
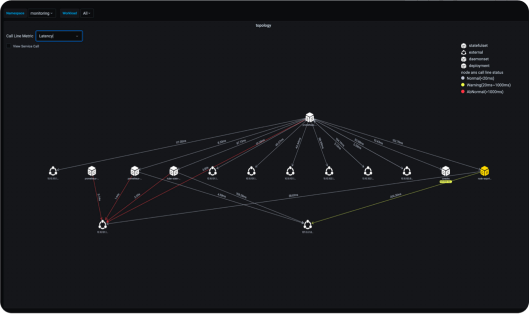
Network Flow Visualization
02
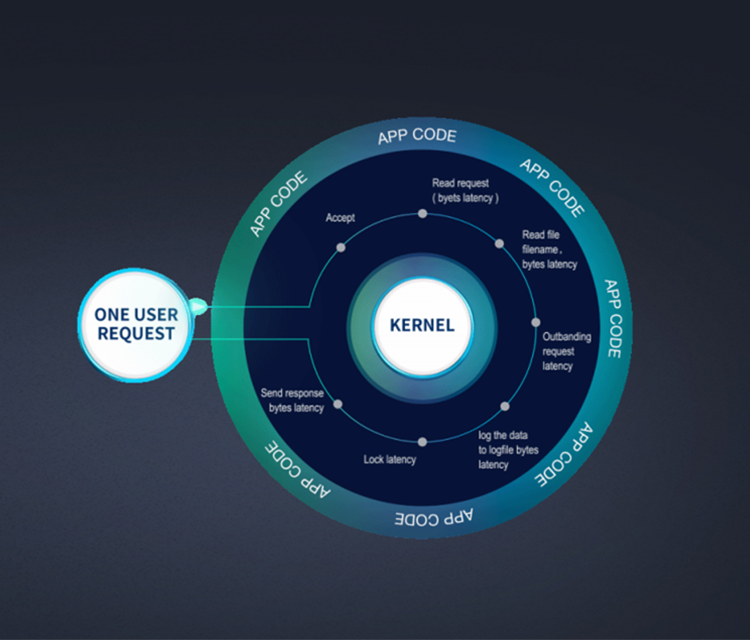
The service map can be viewed and many network metric can be monitored like£¨re-transmit£¨DNS£¨round-trip time. And golden metric like traffic£¨latency, error rate can be also viewed.
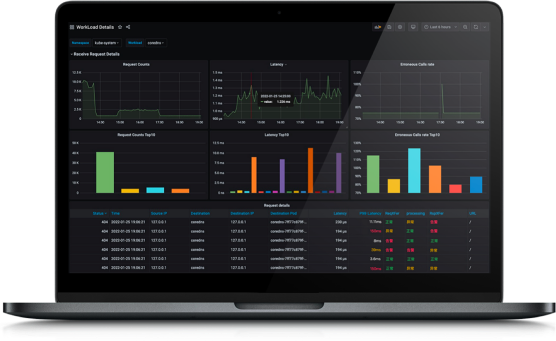
Prometheus Integration For Full Stack Monitoring
03
cAdvisor/MetricServer/Node Exporter/NPD, and Prometheus has been integrated and enriched with Kindling metric for full stack monitoring. The pod and node status metric can be viewed when the user found the response time is slow, and all the data are correlated. Standard version has this feature.
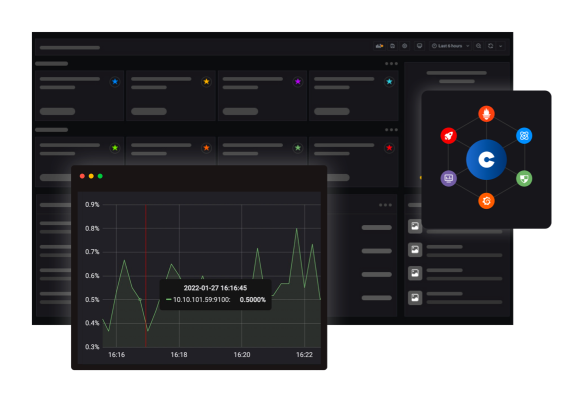
Open Source
04
Kindling will be open-sourced with two version. One is light version can be integrated into Prometheus server and metric can be viewed with Grafana plugin. Another version is the standard version, which has much detailed information and integrated with Prometheus for full stack monitoring.